High Turnover, Low Cash: The Inventory Efficiency Illusion Draining Your Working Capital
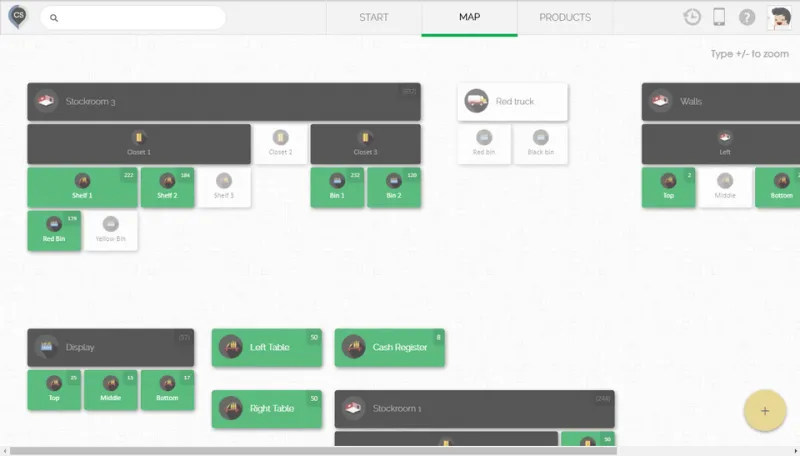
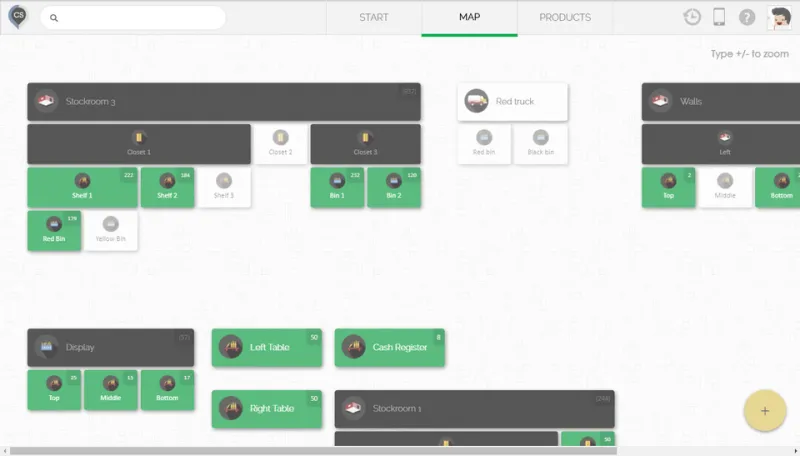
Photo: CyberStockroom.com, CC BY-SA 4.0, via Wikimedia Commons
Inventory turnover is one of those metrics that earns applause in nearly every business review. Products moving quickly, shelves clearing reliably, replenishment orders flowing steadily—it reads like operational success. And in many respects, it is. But for a significant number of e-commerce operators, high turnover is functioning as a distraction, drawing attention away from a cash conversion cycle that is quietly strangling growth.
The core problem is deceptively simple: the speed at which you sell inventory and the speed at which you actually collect and retain cash from those sales are two entirely different things. When those timelines diverge, the business begins financing its own growth in ways that rarely appear as a line item anywhere on the profit and loss statement.
What Turnover Measures—and What It Doesn't
Inventory turnover measures how many times your average stock is sold and replaced over a given period. A high ratio suggests strong demand, lean storage, and efficient purchasing. These are genuine positives. The problem is that turnover says nothing about payment timing, supplier terms, platform settlement delays, or the cost of capital required to bridge those gaps.
Consider a store selling a high-velocity consumable product. Units move within days of being stocked. Turnover looks exceptional. But if that store is purchasing inventory on net-30 supplier terms, selling through a marketplace that holds funds for two weeks post-delivery, and processing returns for 10% of orders—the actual cash cycle is significantly longer than the turnover number implies. The business is continuously buying inventory it hasn't yet been paid for, and the faster it grows, the wider that gap becomes.
This is the phantom inventory problem: the product is gone, the sale is recorded, but the cash hasn't arrived—and more inventory has already been purchased to replace it.
The Cash Conversion Cycle: A More Honest Metric
The cash conversion cycle (CCC) is the metric that honest inventory analysis demands. It measures the number of days between paying for inventory and collecting cash from the customer. A lower CCC is better; a negative CCC—where you collect payment before you pay suppliers—is the gold standard, and it's how companies like Amazon built extraordinary scale without proportional capital requirements.
For most independent e-commerce operators, the CCC is positive and often longer than they realize. It incorporates three components:
- Days Inventory Outstanding (DIO): How long inventory sits before being sold.
- Days Sales Outstanding (DSO): How long it takes to collect payment after a sale.
- Days Payable Outstanding (DPO): How long you take to pay your suppliers.
The formula is straightforward: CCC = DIO + DSO − DPO.
A store with a DIO of 12 days (fast-moving inventory), a DSO of 18 days (marketplace settlement plus return window), and a DPO of 15 days carries a CCC of 15 days. That means for every dollar of inventory purchased, the business waits 15 days to recover it. At scale, that gap represents a substantial and recurring working capital requirement—one that compounds as sales volume grows.
When Growth Becomes the Problem
Here is where the trap closes. Operators who see strong turnover often interpret it as a green light to scale purchasing. More inventory, more sales, more revenue. But each incremental purchase widens the cash gap proportionally. The business isn't just selling more—it's financing more, continuously, and often without a clear accounting of what that financing actually costs.
If the operation is using a revolving credit line or a buy-now-pay-later inventory financing product to bridge that gap, there is a real interest cost attached to every sales cycle. That cost rarely gets allocated to individual SKUs or product categories. It gets buried in general operating expenses, and the fast-turning products that created the gap in the first place continue to look profitable on paper.
This is how a business can post strong top-line revenue, maintain healthy gross margins, and still find itself perpetually short on cash. The P&L looks fine. The bank account does not.
The Hidden Financing Cost in Your SKU Mix
Not all products carry the same cash cycle burden, even within the same store. A product with a 25-day DIO sold through a direct-to-consumer channel with immediate payment processing and a favorable supplier relationship might have a CCC of 10 days. A different product with a 10-day DIO sold through a third-party marketplace with a 21-day settlement window and a supplier requiring upfront payment might carry a CCC of 31 days—despite turning three times faster.
When operators evaluate SKU profitability without accounting for these differences, they are making allocation decisions on incomplete data. Marketing spend, shelf space, promotional priority—all of it gets directed by margin and velocity metrics that don't capture the true cost of carrying and financing each product category.
A rigorous SKU-level profitability analysis should incorporate an estimated financing cost based on the product's individual cash conversion cycle. Even a rough estimate—applying your cost of capital to the average working capital tied up per SKU per sales cycle—will surface meaningful differences that pure margin analysis misses entirely.
Practical Steps for Closing the Gap
Addressing the cash conversion cycle problem doesn't require overhauling operations overnight. Several targeted adjustments can meaningfully reduce the gap.
Renegotiate payment terms with suppliers. Extending DPO from net-15 to net-45 on key SKUs can substantially improve the CCC without touching any other variable. Suppliers are often more flexible on terms than operators assume, particularly for accounts with consistent order histories.
Prioritize direct channels for high-velocity products. Marketplace settlement delays are a significant driver of DSO inflation. For products with strong repeat purchase rates, driving customers toward a direct-to-consumer channel can reduce collection time by a week or more per cycle.
Model your CCC before scaling. Before committing to a large inventory purchase or expanding a product line, calculate the projected cash conversion cycle for that investment. Understand how much working capital will be tied up, for how long, and what it will cost to finance that gap.
Revisit your return window policies. Extended return windows inflate DSO by creating uncertainty around final cash collection. Where category norms allow, tightening or restructuring return policies can reduce the effective collection period without materially impacting conversion rates.
Turnover Is a Symptom, Not a Strategy
Inventory turnover will always be a useful operational indicator. But treating it as a primary measure of financial health is a mistake that costs e-commerce operators real money—money that shows up as a vague cash shortage rather than a clearly attributable problem.
The businesses that scale profitably are the ones that understand what their numbers are actually measuring. Turnover tells you how fast your products move. The cash conversion cycle tells you whether that movement is building the business or quietly funding a gap that grows faster than revenue. For any operator serious about sustainable growth, the second number is the one that deserves far more attention.